# Perform calculations and construct plots here.Lab 6 Experimental Design II
Name:
Skills
- Get more experience designing and executing a scientific experiment.
- Learn the appropriate structure, style, and content of a scientific proposal.
Background Information
Standing Waves
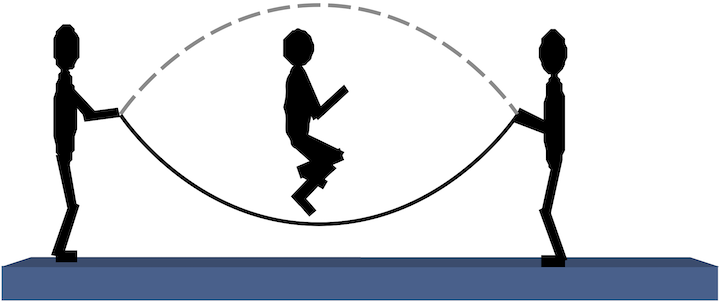
Standing waves result from making waves that reflect back on themselves, or by making waves on both ends of a string. When we were children we formed a type of standing wave with jump ropes.

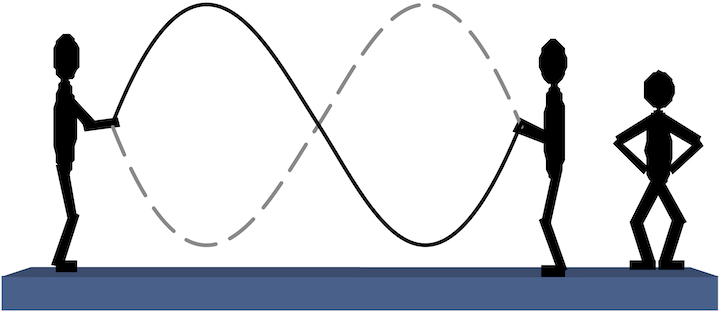
This standing wave had a part that went up and down in the middle and two parts that did not move much on each end (called nodes). But if you had a bored kid, you might have seen a standing wave that looks like this.

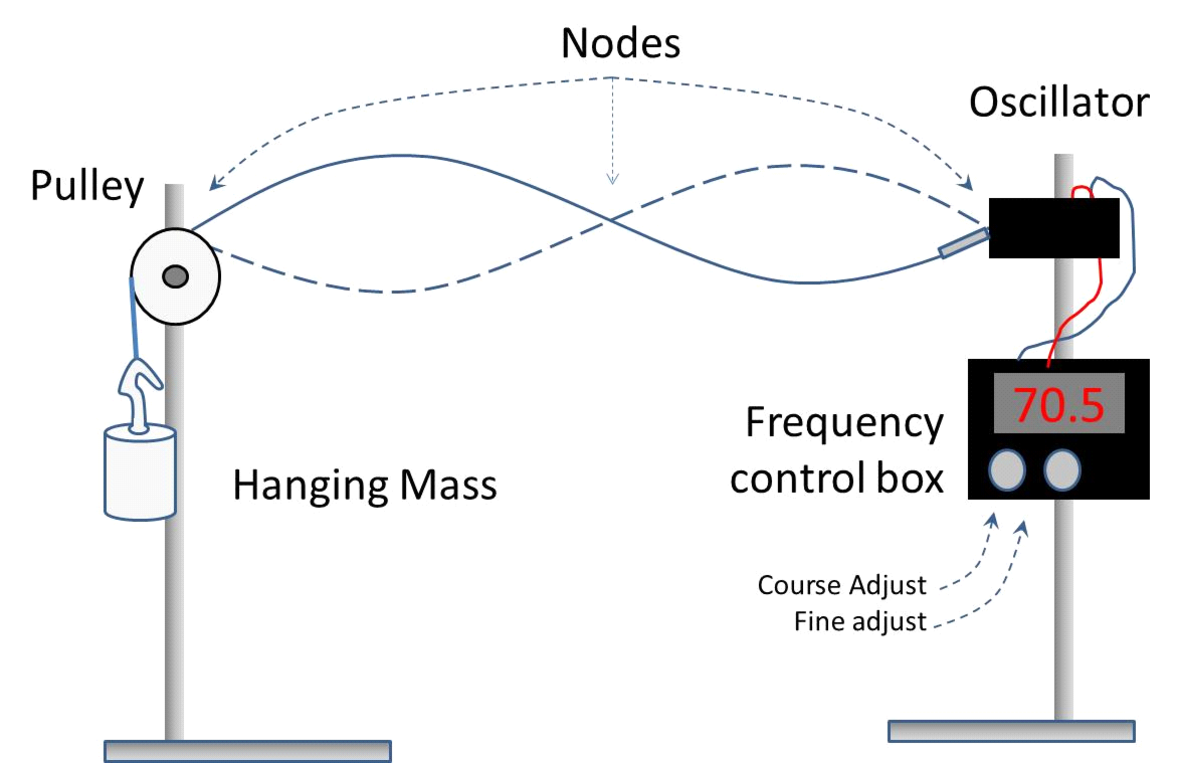
This is not so good for jumping, but makes an interesting picture. The part in the middle that does not seem to be moving is called a node. Really there are also nodes on each end of the rope as well. So altogether there are three nodes in this picture. We can make standing waves that have many nodes. If you try this with a jump rope, you will find that the more nodes you have, the faster you have to shake your end of the rope. Another way to say this is that the frequency of your wave you are making must increase with the number of nodes. This is part of today’s model. In the setup on your table, ring stands are holding strings, and there is an oscillator on one end that has a frequency control box. The other end has a pulley and a hanging mass to provide tension on the string.

Experimentally we find that not all frequencies will make standing waves. So our model includes the idea that only some frequencies produce standing waves. Our model also includes the idea that the weight of the string will change which frequency will make a standing wave. If you play a stringed instrument, you may have noticed that some strings are thicker than others. Thicker strings have different standing wave frequencies than thinner strings. If you study this model (some of you will in PH123), you can derive an equation that tells which frequencies will work \[f={n\over 2L} \sqrt{ Mg\over \mu}\] where n is an integer (\(n = 1, 2, 3 \dots\)). This integer for strings is the number of nodes minus one \(n = n_\text{nodes} − 1\). So you can form a standing wave, then count the places that don’t seem to move (remember the ends!) and subtract one to find n. The frequency that creates the standing wave should be a function of \(n\). Our model tells us that if we know n, we should be able to predict the frequency. You will find that for each way you can make a standing wave, a small range of frequencies will make the standing wave, not just one, single frequency. But the frequency that produces the largest standing wave is the one we want (biggest amplitude–or the one for which the wave looks bigger) . That was the \(f\) that was included in forming our model equation. Of course there are other variables in our equation, so we should find out what they are.
The quantity \(\mu\) is the linear mass density. It is defined as mass of the string divided by the length of the string. So μ tells us how massive the string is. The quantity \(L\) is the length of the string that is participating in the waving, \(g = 9.8004\) m/s\(^2\) is the acceleration due to gravity, and \(M\) is the hanging mass tied to the end of the string beyond the pulley. One way we could verify our model equation is to use it to predict one of the input values. Let’s use \(\mu\). The idea is to use our model equation to somehow find μ and then measure μ to see if the model equation prediction is good.
Last week we learned that we can take more than one measurement, and use those measurements together with a curve fit to solve for a fit parameter. The quantity \(\mu\) should be in one of the fit parameters. Then you can solve for \(\mu\) using the fit parameter given by your Python linear fit code. This is a more robust way to find \(\mu\), and it is the way I want you to proceed.
You may have to adjust the amplitude knob on the frequency controller for some frequencies to keep the apparatus from shaking itself apart. The frequency controller has a fine and a course frequency adjust knob, and a digital frequency display.
Research Proposal
At the end of the semester you will be asked to design and carry out a high-quality physics experiment. As part of that process you will submit a research proposal. A proposal is a document that is intended to persuade someone (your professor, funding agency, yourself, etc.) that you should be given the resources and support to perform the experiment. Your proposal should include a short explanation for each of the following topics:
- Statement of the experimental problem
- What hypothesis are you testing?
- Why is this experiment a noteworthy endeavor?
- Procedures and anticipated difficulties
- What data are you planning to collect?
- How will this prove/disprove your theory?
- Proposed analysis and expected results
- What mathematical analysis will you perform?
- Preliminary List of equipment needed
- What equipment will you need?
A short explanation of each element is discussed below.
Statement of the experimental problem
This is a physics class, so the experiment should be a physics experiment. The purpose of the experiment is to test a model/hypothesis. This section of the proposal should explain the experimental problem and the model/hypothesis that is being tested.
Procedures and anticipated difficulties
The first section should be sufficiently intriguing that the reader is encouraged to read on to learn how you will prove that your model is correct. This section of the proposal is all about the experimental setup and the data you plan to collect. Provide some details about how the experiment will be performed and what data you plan to collect. You should also explain in some detail how the experiment will prove or disprove your model. If there are elements of your procedure that will be especially challenging, explain how you plan to get through them. This is essentially steps 1-6 of the experimental design strategy that was introduced last week.
Proposed analysis and expected results
In this section you should describe the plan for analyzing the data and also how you will know if your experiment successfully proves your model (what does success “look like”?). This often involves fitting a function to your data, linearizing the data, and/or plotting the data in a way that proves the expected relationship. Explain in detail which mathematical analysis you chose and justify that choice.
You should also discuss the uncertainties that will be present in your experiment and demonstrate that you can achieve an acceptable level of uncertainty with the equipment you are requesting. One theme from this class is that uncertainties in measurements propagate through when used in calculations. In short, uncertainties in calculations can be very different from uncertainties in measurements. When planning an experiment, it is important that you verify beforehand that you can achieve an acceptable level of uncertainty on your final result. This means that you must estimate the uncertainty of your final result and verify that the presumed uncertainties in your measuring devices are sufficiently small. When performing these calculations, it is ok to use order-of-magnitude estimates for measurement values and instrument uncertainties. This analysis will help you make an informed decision about what equipment to use.
During Brother Lines’ career in industry, the US Naval Research Labs once asked his team to build a microwave radiometer to measure the sea wind direction from space. After their predicted analysis, they concluded that they would need a very expensive instrument to be able to successfully measure the wind direction to a reasonable level of uncertainty—it would take more money than they were offering. NRL disagreed with their conclusion and built the device themselves at lower cost, but also to lower specifications with much greater uncertainties. They spent a billion (yes, a billion with a “b” ) dollars to launch the device into space. The device was a total failure because the uncertainty was so big that the data was essentially useless. We want to find out whether our experiment will work before we risk our grades (or a billion dollars) on it. So we will do the prediction ahead of taking the data.
In this class we have used sympy to calculate uncertainties. You should use sympy again to calculate the uncertainty that you will need from your equipment to achieve an acceptable level of uncertainty in your final result.
Preliminary List of equipment needed
Once you have done your analysis, you are ready to list the equipment you will need to carry out your experiment (that is, list the uncertainties you need to achieve). Final approval of the project and the ultimate success of your experiment depends on the equipment you choose or are granted. You want to do a good job analyzing so you know what you need, and a good job describing the experiment so you are likely to have the equipment you want available when you start.
The rubric that will be used to grade your proposal can be found here
Activity I (standing waves)
Design and carry out an experiment involving standing waves on a string. Record your work below.
- Identify the system being studied. List all relevant variables.
Your response:
- Identify the hypothesis or model that you will test. Provide both a verbal description of this model and and mathematical equation. (use \(\LaTeX\))
Your response:
- How will you know if your experiment is successful?
Your response:
- Linearize your equation if possible.
Your response:
- Choose reasonable ranges for the pertinent variables in your experiment.
Your response:
- Plan the experimental procedure.
Your response:
- Carry out the experiment and report your results. Include all data collected, plots constructed and give evidence for or against your hypothesis. Data should be placed in a table of some kind. You can either use a markdown table in a text cell or a Pandas dataframe (see activity I from lab 2 for a refresher) to display the data.
Your response:
Activity II (Proposal)
Work on your research proposal. They are due in two weeks.