# Perform calculations and construct plots here.Lab 7 Experimental Design III
Name:
Skills
- Get more experience designing and executing a scientific experiment.
- Learn the appropriate structure, style, and content of a scientific report.
Background Information
Conservation of Energy
Conseravtion of energy is one of the most fundamental and well-established ideas in physics. It states that the total energy of an isolated system must remain fixed and unchanged as time progresses. If one type of energy decreases, the amount of another type of energy must increase so that the total energy never changes. This week you will design an experiment to prove this hypothesis. You can choose between two experiments: a sphere rolling down an incline or a simple pendulum.
Sphere on an Incline
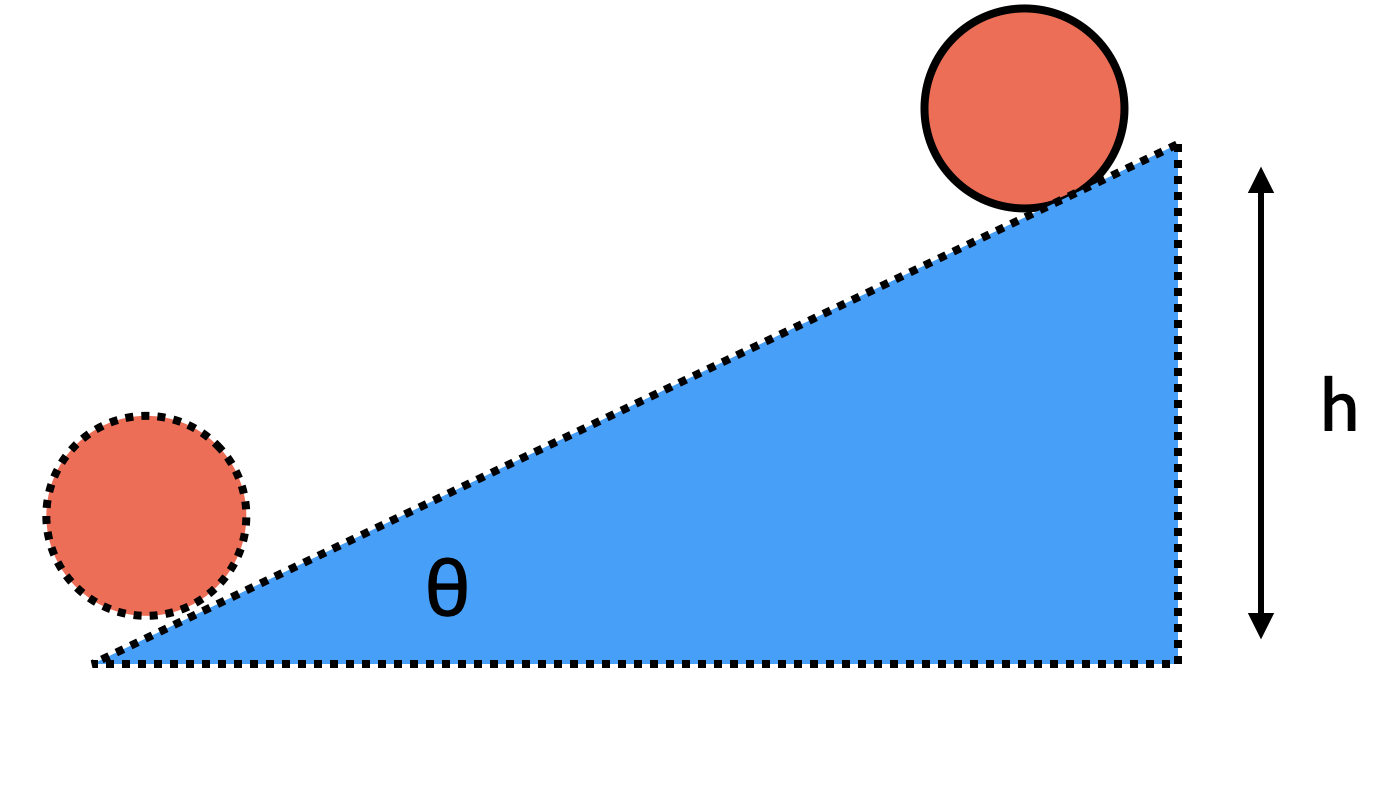
A sphere that rolls down an incline will gain kinetic energy (both translational and rotational) as it loses gravitational potential energy (because its height is decreasing). Mathematically, this can be stated as

\[ U_i = K_f\] where \(U_i = M g y\) is the initial potential energy of the sphere and \(K_f ={1\over 2} M v^2 + {1\over 2} I {v^2\over r^2}\) is the total kinetic energy of the sphere at the bottom of the incline. Plugging these in and reducing gives.. \[M g y = {1\over 2} M v^2 + {1\over 2} I {v^2\over r^2}\] \[M g y = {1\over 2} M v^2 + {1\over 2} c M r^2 {v^2\over r^2}\] \[M g y = {1\over 2} M v^2 + {1\over 2} c M v^2 \]
\[M g y = {1\over 2} M v^2(1 + c)\] \[ y = {v^2\over 2 g} (1 + c)\]
Here \(c\) is the constant in the moment of inertial value and should be equal to \({2 \over 5}\) for a sphere. Your goal if you choose this experiment is to design an experiment that proves that this relationship is true and to calculate a value for \(c\) with its uncertainty.
Simple Pendulum
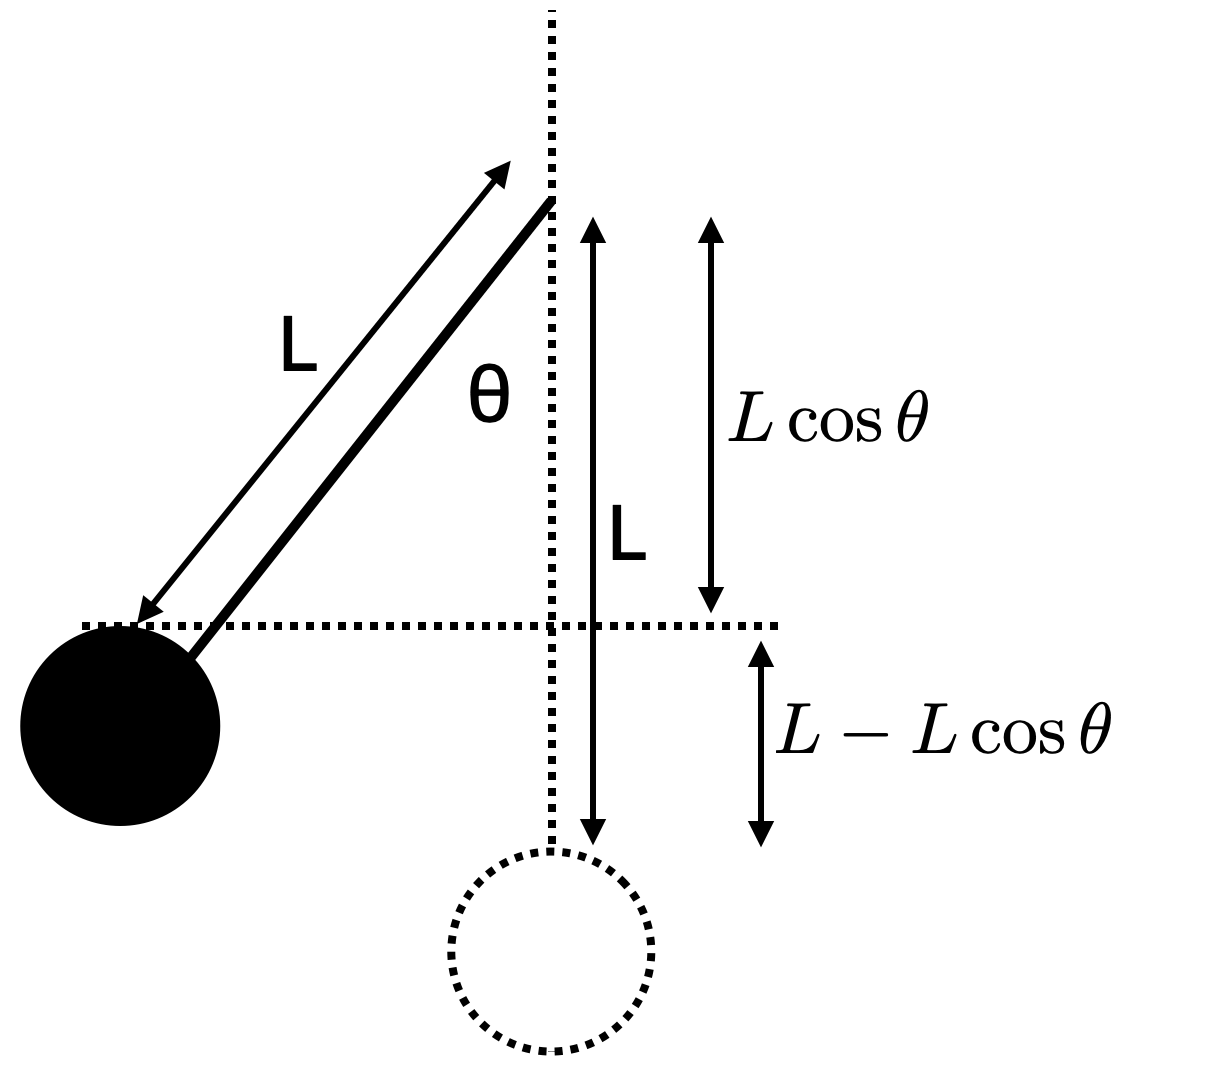
The motion of a pendulum is also a good illustration of the concept of conservation of energy. When the pendulum bobs is at its highest point, it is briefly motionless and hence has no kinetic energy. It only has potential energy. Then, as the pendulum swings downward its potential energy is converted into kinetic energy. In order for energy to be conserved, these two energies should be equal.

\[ U_i = K_f\]
\[M g y = {1\over 2} M v^2\]
\[M g \left( L - L \cos \theta_i\right) = {1\over 2} M v^2\] \[M g L\left( 1 - \cos \theta_i\right) = {1\over 2} M v^2\]
\[ \left( 1 - \cos \theta_i\right) = {v^2\over 2 g L} \] If you choose this experiment, once you have verified the relationship, you should calculate the length of the pendulum with its uncertainty and compare to a measured value.
Measuring the velocity
To find the speed of the ball(or pendulum) with its uncertainty, you’ll need to use a photogate placed at the location where you want to measure the speed. Here are a few tips/steps to follow to be successful.
- A photogate shows the time that the laser was blocked,so to turn that into a speed, you’ll need to divide a distance by the time
- To get the uncertainty in time, make several measurements and find the average and standard deviation of your data.
- If the laser isn’t perfectly aligned with the center of the ball as it goes through, then the part of the ball that blocks the laser will be shorter than the diameter (i.e. less ball will travel through the laser beam). With a bit of geometry, you can show that \(d_\text{beam} =d_\text{ball}\sqrt{1 - \alpha^2}\) where \(d_\text{beam}\) is the amount of ball that went through the beam, \(d_\text{ball}\) is the actual diameter of the ball, and \(\alpha\) is how far from the center of the ball the beam is (as a ratio of the radius). Here’s an example on how to use this equation: If the diameter of the ball were \(2\) cm, and I think that I can confidently keep the laser within \(0.5\) cm of the center of the ball (50% of the radius), the smallest diameter that I would expect to pass through the beam would be: \[ d_\text{beam} =(2\text{cm}) \sqrt{1 - 0.5^2} = (1.73 ~\text{cm}) \approx 1.7~ \text{cm}\] Since I’d expect my diameter to be somewhere between that number and 2 cm, I’d quote the diameter that passes through the beam to be \(1.8 \pm 0.2\) cm.
Scientific Reports
A scientific report is a detailed description of an experiment that you have performed. The purpose of the report is to add the analysis, results, and conclusions from your work to the collection of knowledge in the scientific community. It is important that your report/experiment involves experiments, analysis, and/or results that have not been presented previously. When publishing your report in a scientific journal, the journal will select referees to review your work and ensure that it is original and that no errors have been made in the experiment. Your report for the student-designed experiment should include a short explanation for each of the following topics:
- Introduction
- What do we already know about the physics of your experiment?
- What hypothesis/model are you testing?
- How will you know if you are successful?
- Experimental Setup
- What did your experiment look like?
- What measurements did you perform?
- What equipment did you use?
- What were the uncertainties in your measurements?
- Results and Analysis
- What data did you gather?
- What analysis did you perform?
- How did you calculate the uncertainty in your final result?
- Conclusion
- Did you prove or disprove your theory.
- What are you going to do next?
A short explanation of each element is discussed below.
Introduction
The introduction should “hook” your audience, or convince them that your experiment is worth their time and attention. Explain the physics involved in your experiment and state the hypothesis that you are testing. If anyone else in the scientific community has done work in this area, mention them and give them credit with a citation of their work. Make a convincing argument for why this work/experiment is a noteworthy contribution to the scientific community.
Experimental Setup
In this section you should describe how you setup your experiment. Often, referencing a well-crafted figure can help this discussion greatly. Any figures must have captions with detail sufficient that a reader could understand the figure without reading the main body of the paper. The equipment used in the experiment should be described with their associated precisions (state their uncertainties). Describe how you collected the data and explain any challenges that arose during that process.
Results and Analysis
In this section you should present your results in a table and/or plot for easy viewing. All plots and tables must have detailed captions and plots must have axes labels and titles that are easily viewable to the reader (without squinting!). If you linearized the data or fit a function to the data, explain how this was done and state your results with uncertainties. Explain how the uncertainty analysis was performed and state all calculated uncertainties. Any math that was performed should be included in this section.
Conclusion
Explain why the results of your experiment verified or failed to verify your hypothesis. Describe what the next step in this experiment might be.
The rubric that will be used to grade the report for your student-designed project can be found here
Activity I (Conservation of Energy)
Design and carry out an experiment involving conservation of energy. You can choose an experiment involving a simple pendulum or a sphere rolling down an incline. Your goal is to prove that energy is conserved and calculate any relevant physical quantities with their uncertainties. Record your work below.
- Identify the system being studied. List all relevant variables.
Your response:
- Identify the hypothesis or model that you will test. Provide both a verbal description of this model and and mathematical equation. (use \(\LaTeX\))
Your response:
- How will you know if your experiment is successful?
Your response:
- Linearize your equation if possible.
Your response:
- Choose reasonable ranges for the pertinent variables in your experiment.
Your response:
- Plan the experimental procedure.
Your response:
- Carry out the experiment and report your results. Include all data collected, plots constructed and give evidence for or against your hypothesis. Data should be placed in a table of some kind. You can either use a markdown table in a text cell or a Pandas dataframe (see activity I from lab 2 for a refresher) to display the data.
Your response:
Activity II
Following the guidlines given above, write a short scientific report for the experiment that you just performed.